


To arrange and display data, a lot of companies are turning to Tableau as a tool for business intelligence (BI) tool renowned for its ability to perform large-scale data analysis. Tableau can handle huge data sets and provide instantaneous analytics for businesses that rely on data, which makes it a preferred option across all sectors.
But BI tools like Tableau aren’t without their limitations. Their high cost and steep learning curve make them not a good solution for everyone, causing many companies to search for alternatives that have similar capabilities, but with less hassle. Let’s take a look at the features of Tableau, and why you might want to think about Tableau alternatives, and a few of the best rival BI tools to assist you in determining the most suitable solution to your needs in 2025.
What is Tableau?
Tableau is an analytics and visual platform that comes with several products, including servers, desktops, online, and reader software. While the company provides a free online version, known as Tableau Public, the paid version is more powerful and ideal for business applications.
What are important alternatives to Tablo?
There are a variety of reasons Tableau is often referenced in industry reports on analytical and business intelligence. It provides captivating data visualizations, includes powerful computing capabilities, and provides valuable information. Many users are unhappy with the costs of ownership lengthy setup, and its limitations in options for formatting. Many users are not able to master the technology or are frustrated with the limitations of performance.
However, the field of business intelligence is changing quickly, and many Tableau alternatives have come up that provide the most intuitive and affordable user experience. Here are some reasons to think about alternatives to Tableau:
- Budget restrictions: Tableau is one of the more costly BI tools available, which can be cost-prohibitive for smaller businesses or companies that want to reduce costs. It is expensive to license Tableau Desktop, Server, or Tableau Online can add up quickly, especially when you’re expanding across large teams.
- Steep learning curve: A lot of non-technical or novice users struggle to master Tableau’s complicated interface and scripting requirements, especially when dealing with advanced analytics or data preparation.
- Limited customization: Businesses that require deeply embedded and distributed analytics that are customized to the needs of their customers might find Tableau’s options to be restrictive.
- Requires other software: Tableau typically requires clean, well-processed data for the best performance. Therefore, users have to invest in other ETL tools.
- Underwhelming performance: While Tableau can handle massive datasets, a lot of users experience a slowdown when dealing with complex data or when creating custom individual reports.
Tableau alternatives can offer the chance to make better decisions along with more specific, based on data information. By integrating tools to specific business needs and workflows, you can increase effectiveness and efficiency. For instance, teams with lower technical skills can benefit from features such as templates that are pre-built and faster processing speeds, and more comprehensive integrations.
Also read: 10 Best CapCut Alternatives for Video Editing in 2025 (Free & Paid)
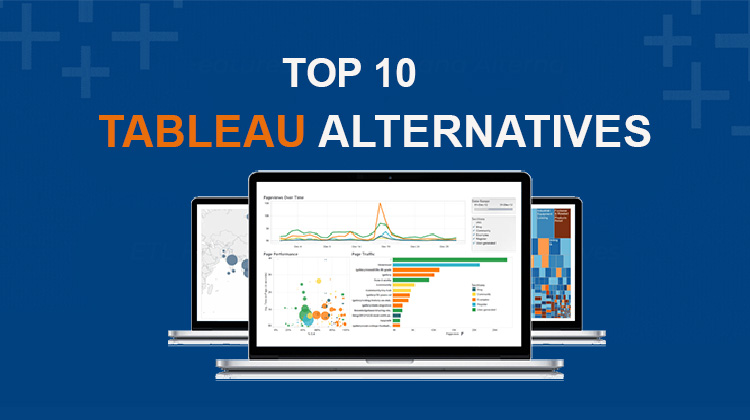
Top 10 Tableau Alternatives
Here are ten interesting Tableau alternatives to think about for 2025. Compare the advantages and disadvantages to determine the ideal solution for your particular requirements.
1. Domo
Domo is the best BI system that offers visualization and data integration transformation, and beyond. It also comes with tools to create custom and ad-hoc dashboards that feature well-designed user interfaces and a vast range of chart templates. Domo is designed for cloud computing, which means that queries on huge datasets can be finished in just a few seconds. Intelligent applications allow custom low-code and no-code application development.
Key features
- Mobile application: Access all features of the nimble mobile application that works on all devices that including data visualization and report creation, and much more.
- Self-service Business Intelligence: Use internal data science tools to conduct sophisticated analysis. No technical skills are required.
- Speedy data processing: Get data analysis in just a few seconds, and with only a few clicks, and fewer moves than some similar BI tools.
- Integrity capabilities: Integrate with many applications, data sources, and other tools.
- Training and education: You can get support from a vibrant user community, Domo University tutorials, and the Domo Knowledge Base.
2. Sisense
Sisense is a software that provides a variety of capabilities to help you gather business intelligence. It is able to handle massive datasets in the areas of processing, data analysis, and visualisation. It comes with unique technology that is built inside the chip (to increase processing speed) and embedded analytics, and integrated AI. Users can design custom white-label dashboards, visuals, and reports with drag-and-drop capabilities. Sisense also has tools for collaboration, which allow users to share information, set alerts, and more.
Key features
- Customizing apps: Use of Sisense SDKs and APIs to develop and personalize your application, and also integrate analytics.
- Sisense Cloud: Host your server within your local environment while benefiting from support by dedicated technical teams and the Sisense Information Security program.
- Embedded Analytics: Create custom visualizations of data right within your application.
- Data Connectivity: Leverage over 400 data connections and a scalable engine to access real-time insights and consolidated reporting.
- Data Security: Ensure your data remains secure and compliant with industry-standard certifications such as SOC 2 Type II, ISO 27001, and ISO 27701.
3. Power BI
Microsoft’s Power BI is one of the best Tableau alternatives that allows users to connect to, transform, and display data from a variety of sources such as cloud-based services, Excel, APIs, and much more. It is compatible with other Microsoft tools such as Azure, Copilot, and Fabric, which makes it an ideal choice for users who are already part of this part of the Microsoft ecosystem. Prices range from free to business prices, and include options for companies of any size. Power BI also includes Power Query as an instrument to clean, shape, and enrich data.
Key features
- AI-powered insight: Uncover trends, create insights, and carry out advanced analytics using built-in AI tools such as natural language queries.
- Enterprise-grade security: Get peace of mind with row-level security and the integration of Azure Active Directory, a tool for managing access security.
- Training courses: Learn new skills and receive support via Microsoft Training courses.
- Sharing reports: Embed and share reports using other Microsoft tools like Teams, PowerPoint, or Excel.
- Microsoft Fabric integration: Access Power BI reports and other applications for free in Microsoft Fabric.
4. Qlik
Qlik offers self-service analytics and tools for data discovery with a focus on data insights. The associative engine allows users to browse data interactively without the restrictions of predefined data routes. AI-driven functions enable the use of natural language, for example, predictive analytics and automated insight. Embedded analytics can be customized using white label customization options. Qlik facilitates collaboration by sharing workspaces, annotations, and even annotated spaces.
Key features
- Real-time data integration: Improve data availability and flexibility without the requirement for experienced developers.
- Automated data transformation: Develop exciting data models and receive continuously refined
- Automation of data warehouses: Streamline the data warehouse process using automated tools.
- Data lake creation: Ingest and update data using a zero-code model-driven method.
- Data connectors and sources: Connect and combine data from top applications such as AWS, MySQL, Oracle and Azure.
5. Yellowfin
With options to run in the cloud or on premises, Yellowfin is a flexible BI solution designed for embedded analytics and enterprise analytics. It also allows the creation of custom analytical software. To achieve the best outcomes, the software should be paired with a speedy, dedicated reporting database designed to be used for high-speed analytics. Yellowfin’s ETL module allows data extraction and transformation, be it blending data from various sources or turning data into visualisations.
Key features
- Metadata modelling: Use drag-and-drop features to analyse data and obtain suggestions on the next steps.
- Data discovery: Machine learning is used to understand data by utilizing AI-driven insights.
- Yellowfin Stories: Create long-form narratives using text, data visualizations, images, videos, and text.
- Mobile access: Install the Yellowfin application to keep up-to-date while you’re moving.
- Automated business monitoring: Set alarms for thresholds and Yellowfin Signals that employ automated procedures and AI to search through data to identify statistically significant changes.
6. Looker Studio
Google’s Looker Studio enables the creation of shareable, custom-designed graphs and charts. It is compatible with over 800 data sources and allows seamless integration with Google’s suite of software and services, like Google Cloud, Sheets, Google Analytics, and BigQuery. The self-service option of the Looker Studio is completely free, whereas Looker Studio Pro is an affordable option.
Key features
- Interactive dashboards: Design and build customizable dashboards that include interactive filtering and drill-downs, and real-time updates.
- Collaborative and Sharing: Allow teams to edit reports together and send them to the stakeholders via hyperlink or email.
- Visualization library: Pick from a variety of predesigned graphs and chart templates, with the option of incorporating third-party visuals.
- Scheduled report: Automate report delivery, without any need for manual intervention.
- Report embedding: Simply embed Looker Studio reports to any webpage or intranet.
7. Databox
Databox is a BI tool used for monitoring results, displaying data, and distributing custom presentations. Forecasting tools let users predict future performance and examine results with data from the past, as templates that are pre-built and ready to use let you easily model data. Databox connects to more than 100 tools and connects to APIs, and can connect to company databases. Users can also upload spreadsheets to track their custom metrics.
Key features
- Data Reports: Build, share, and modify reports. You can then archive them or make notes to be used in the future.
- Benchmark data: Search for data on business indicators, such as size or revenue, industry or even company type.
- Setting goals: Define goals for any KPI or metric and track progress with charts and other visualisations.
- Custom Dashboards: Include logos and colors of the company, or design customized dashboards for clients.
- Data forecasting: Use of predictive analysis to set precise targets and determine the validity of forecasts from the past.
Also read: Top 10 Wayback Machine Alternatives
8. SAP Data Intelligence Cloud
SAP Data Intelligence Cloud allows data integration, automation, and management. These Tableau alternatives are compatible with other SAP solutions, such as SAP HANA, SAP Analytics Cloud, and can also work with non-SAP data sources that include unstructured, structured,cloud-based, on-prem, and cloud systems. It allows real-time and batch processing, using built-in software like AI and machine learning. AI.
Key features
- Governance and Compliance: Get security with role-based access control, audit trails, and other features to ensure compliance.
- Multi-cloud and hybrid support: Easily manage data across different environments.
- Machine learning: Create and apply ML models to predict, analyze, detect anomalies, and much more.
- Centralized ratings and rules: Make a glossary of business regulations and ratings.
9. Mode
Mode is an integrated set of tools for data analysis. It was designed to allow data and business teams to collaborate through ad hoc analysis, self-serve reports, and advanced analytics. Mode can connect to a variety of important data warehouses, such as Azure, BigQuery, Hive, and MySQL. Users can create custom data apps, which include interactive dashboards and data visualizations.
Key features
- SQL Editor: Find data to explore and run multiple queries to gain insight into the data in its raw form.
- Visual Explorer: Create bar charts and line graphs, tables, and much more to facilitate data exploration and telling stories.
- Integrated notebooks: Write SQL to analyze and interpret data with models for forecasting, predictive, and other modeling techniques with Python.
- Dashboards and reports: Formulas can be created and reused that are specific to the existing results of a query.
- Customized data apps: Apply complete HTML modifications to meet the specific requirements of your business.
10. ThoughtSpot
ThoughtSpot is a BI tool specifically designed for non-technical users and search and offers an AI-driven analytics experience that provides drill-downs and open-ended data exploration. It allows live data access without the need for data aggregation. It also integrates with Snowflake, BigQuery, Databricks, and other well-known tools. It also allows ad-hoc report creation and automated detection of anomalies.
Key features
- Liveboards: Design interactive dashboards using cloud data. Then, pin, rearrange, or display visuals.
- Natural language search: Use a natural language query to analyse the data and gain new insights.
- Augmented analytics: Monitor business metrics and receive alerts for anomalies automatically or create specific alerts.
- Data importing: Import metadata information related to columns and tables from your data catalog.
Conclusion
As you evaluate potential Tableau alternatives, pay special attention to ease-of-use, integration, and cost considerations. Tools like Power BI, Sisense, and Looker offer impressive features tailored specifically for different requirements – assess each tool carefully to find one that best fulfills the data analytics and visualization goals of your organization.


Leave a comment